Data Visualizer


Visualizer Tool
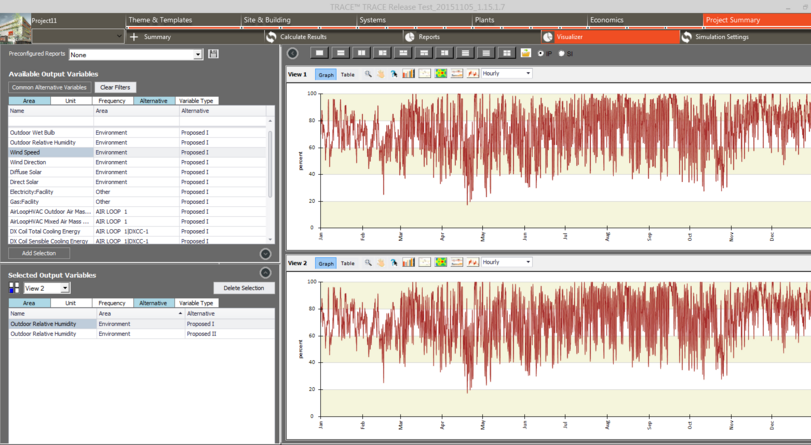
After running an alternative with time-series output variables, the visualizer can be used for viewing timestep, hourly, daily, monthly, and run period frequency outputs. In addition to viewing timestep or hourly plot charts, you can also view data using the table option, surface chart, bar chart, and box and whiskers tools. On the left side bar, select the outputs you would like to view. The view window displays the output data for the selected outputs. You can modify the view options within the tool by interacting with the icons in the view window.
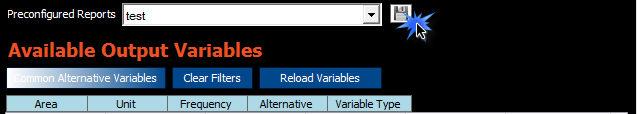


Left side bar
The left side bar in the visualizer tool is used for selecting output variables used in viewing output data in the graph and tables viewing pane. The side bar includes an option to select or save a pre-configured output report or to add output variables used for viewing in the Available Output Variables list.


Select Alternatives
The alternatives selection allows the selection of the alternative’s outputs to be viewed using the visualizer tool. Only alternatives where the visualizer was enabled and simulated will appear in the alternative selection dialog window.
 
Pre-configured Report
The pre-configured report selection allows a set of output variables with appropriate formatting of the graph to be selected quickly. Since not all variables are output for each simulation run, there may be missing outputs variables that correspond to the selection of the pre-configured report. In these cases, the visualizer report graphs or tables will be incomplete.
 
 
Save Configuration
The Save Configuration button allows a custom set of output variables and custom chart/graph properties to be saved for the purpose of quickly referring custom reports. First, select the output variables from the “Available Output Variables” list and select “Add Selection”. After selecting the output variables the output viewing area can be manipulated by adjusting the chart types and graph properties.
Hit the “Save Configuration” button and name the report.  The newly created output report will be available on the list of Preconfigured Reports.
 
 
Available Output Variables
This displays the Output Variables that are available to incorporate into Results Views.  The list is determined by the Output Variables that are defined in the Select Time-Series Variables screen that is established pre-simulation.  The table contains a number of ways that the Output Variables Set can be filtered, so that they can be managed more effectively to obtain the desired Output Variable selection. 
Once identified and chosen select Add Selection.  This will add that Output Variable to the Output Variable Selection table and incorporate it into the active Results View.


Input Considerations:
Simulation time and the size of the Results file are directly related to the number of Output Variables that are included in the selection of the time-series variables.  This is the main reason why all of the available output variables and meters that are available in the application should not be selected.  It is important to be selective which output variables are needed to be investigated in the Visualizer before selecting the output variables.  While in the visualizer, if the results for an output variable that is not available for selection, are needed then that Output Variable will need to be added and the simulation rerun.
 
 
Common Alternative Variables
The “Common Alternative Variables” button provides a filter to only display output variables that contain data for multiple alternatives. When selecting this button and selecting variables, all alternatives that have data associated with that output variable will be added to the selected output variables section.
For example, if Alternative 1 and Alternative 2 both contain DX Coil output variable data, then that output variable will appear in the available output variable list when “Common Alternative Variables” is selected.
 
Clear Filters
The “Clear Filters” button clears the output variable filters that had previously been applied to the list of Available Output Variables. Filters can be applied to the list of Available Output Variables by clicking on the down arrow filter options in the column list headers.
 
Add Selection
After selecting a variable in the Available Output Variables list, click the “Add Selection” button to add the output variable to the Selected Output Variable list. When adding variables to the Selected Output Variables list, the units for the variables selected cannot exceed 2 units. For example, Outdoor Dry Bulb, Outdoor Relative Humidity, and Wind Speed cannot all be added to the Select Output Variables because they each contain different units.
 
Active View
A drop down list located beneath the Selected Output Variables header allows the selection of different views to make active within the current view configuration.  The drop down list will display the number of views created. Once a new result view selection has been made, the Selected Output Variable table updates to display the output variables associated with the active Results View.
 
Delete Selection
Selecting Delete will remove the current output variable highlighted within the Selected Output Variables table from the table as well as from the current Results View.
 
Selected Output Variables
The Output Variables associated with the current Results View are displayed in this table.  If there is more than one Results View, the active Results View can be changed by either selecting from the drop down list above the table or selecting the view directly.  Changing the active view will modify the Output Variables shown in the table.  The columns in the Selected Output Variables table can be varied by selecting the column headers shown below the view drop down list.  The columns displayed in the table below can be toggled on/off by either selecting (colored) or deselecting the column header.  In addition, Output Variables can be deleted from the table and, ultimately, the current view by selecting the output variable and then hitting the “Delete Selection”.
 
 
View Window
Once an Output Variable has been added to the Selected Output Variables it will appear in the Result View.  The default view format is Graph and the default graph type is Line Chart.


View Configuration Icons
The 10 view configuration options provides the ability to shape the Results View Field in a number of different ways utilizing one to four views.
 
 
Graph or Table Toggle
These two buttons allow switching the results view from graph to table or vice versa.  The default for the results view is graph.
 
Data Zoom
The combination of Data Zoom with the Results View Controls provide a number of zoom features as shown in the example below.
Example
The example walks through the different features that can be used in a number of different combinations. 
Example: The Results View is set up showing output variables. The view shown is the default hourly, line graph results view.
 
Selecting the data zoom icon, a range of months can be selected by highlighting.  The example below shows a selection from Mid-March to late May.  The area being selected will be highlighted in gray.
 
When the mouse is released, the range selection is determined, and the results view of that selection will be displayed. 
 
 
Some additional features appear on the graph for this data zoom view:
 
Red dot (lower left of graph) - By selecting it allows the zoom to go back one step.  This can be helpful if multiple zoom steps have been performed and returning to the previous one is desired.
 
Slider bar (lower part of graph above x-axis labels) - This bar has three components:
       Left Range Boundary - by selecting and dragging it allows lengthening or decreasing the range of time that is being displayed in the Results View
       Range Bar - allows the "range of time" to be kept the same for the Results View and to change the time of year that is being displayed.  
       Right Range Boundary- by selecting and dragging it allows lengthening or decreasing the range of time that is being displayed in the Results View
Any combination of the zoom features can be used to continue zooming in on a particular range of time. To get back to the original default view for the graph select the data zoom icon again.
 
Data Pan
This tool allows free movement of the graph. This is similar to typical pan features.
 
Data Track
Once selected, when sliding over the graph, the actual values of different points on the graph can be viewed.
 
Bar Charts
The bar charts are only compatible with monthly frequency outputs. The frequency of the output variables can be changed using the timestep drop down selection. Below are examples of the bar charts
 
2D Bar Chart
 
 
3D Bar Chart
 
 
Cluster Stack Bar Chart
 
 
Line Charts
Line charts display continuous data over time. Line charts are compatible with any frequency of output variable data. Examples are shown below.
 
Elliott Waves Line Chart
 
Smooth Line Chart
 
 
Stacked Line Chart
 
 
Surface Charts
Surface contour charts are useful when investigating how variables trend based on time of day and time of year. The y-axis displays time of day, and the x-axis displays time of year. Surface charts can only display one variable at a time.
 
 
Surface Chart
 
 
Area Charts
An area chart displays data similarly to a line chart. The area between the x-axis and the line is colored. This type of chart is common when comparing 2 or more variables.
 
 
2D Area Chart
Monthly 2D Area Chart
 
Daily 2D Area Chart
 
 
Stacked Area Chart
 
 
Range Charts
A range chart displays the range of values that exist for a particular variable over a specified time frequency. The range chart type is only compatible with monthly frequency graph. A change to the frequency of a range chart will change the chart type.
 
 
2D Floating Bar Chart
 
2D High Low Chart
 
 
Box and Whiskers Chart
 
 
Frequency Drop Down List
The frequency displayed in the graph can be changed by clicking on the drop down arrow and selecting from the following options:
       Timestep
       Hourly
       Daily
       Monthly
       Run Period
Note: The default frequency displayed in the Result View is determined by the frequency associated with the Output Variable that was added to the Result View. 
Available frequencies are influenced by the frequency selected within the Select Time-Series Variables screen prior to simulation.


Right Click Features
Right clicking on the graph or table provides the options to export, copy, print, and define the viewing properties.
 
 
Export
Export allows a copy of the active Results View to be saved.  The file format options are:
       Bitmap Image (.bmap)
       Gif Image (.gif)
       JPEG Image (.jpg)
       PNG Image (.png)
       Tiff Image (.tiff)
       Emf Image (.emf)
 
Copy
Makes a copy of the active Results View (clipboard) that can then be pasted into another document.
 
Print
Launches a print dialog box allowing a copy of the active Results View to be printed.
 
Properties- Graph
The following are features available in the Graph Properties Dialog box, which can be accessed by moving the mouse within a Results View, then right clicking on the mouse and selecting Properties from the pop-up dialog. The properties that can be edited in the dialog are only related to the Results View that was selected.
Note: Right clicking on a graph view will allow access to the Graph Properties dialog. The Table Properties Dialog can be entered by right clicking on a table view.
 
 
Entity Display
This shows a list of the output variables that are currently included in the Results View and how they will be displayed within the Results View legend. By selecting one of the output variables, the name appears in the Variable Name field and the Legend name field, which can be edited. The name displayed in this field can also be changed by selecting or de-selecting options for parameters within Name Composition. 
 
Variable Name
The default name is shown for the selected Output Variable.
 
Legend Name
This allows the text representation of the legend name to be updated. For example, shortening the name so that it fits better within the legend and the legends location on the graph may be desired.
 
Fill Color
The color for the output variable selected will be shown. To select a different color select the chevron and the options for colors shown below will be displayed. Colors on the "custom" tab can be selected, which will be the current tab, or the "web" or "system" tab. By selecting a new color, it will automatically be associated with the output variable.
Note: There is not a "save" button on the dialog.
 
Fill Transparency
This allows the transparency of the display for the selected output variable to be modified. This feature may be useful for certain graph types more than others. The transparency can be adjusted using the slider bar, by increasing or decreasing the transparency % by selecting the up or down chevrons, or by entering a direct value.
Note: If multiple output variables are associated with a graph view that is being displayed as an area chart, the visualizer will incorporate transparency on the output variables. This is so that, initially, all of the output variables can be seen. 
 
Show Labels
Provides the option to turn on labels for the current output variable by selecting the checkbox. 
Note: Show labels only affects the output variable selected, not all of the output variables in the view. To display labels for the other output variables, select them and then select the check box for show labels.
 
Border Color
Controls the color display for the outline of the output variable representation on the graph type. 
 
Text
The text displayed and the format of the text for a number of visible components of the results view can be adjusted.
 
Text Selection Options
The text components of the results view that can be adapted are:
       Graph Title
       Left Axis Title
       Left Axis
       Bottom Axis Title
       Bottom Axis
       Right Axis Title
       Right Axis
       Data Labels
Selecting a component from the list makes that text component active. Any changes are only associated with that text component.
 
Font Type
The drop down list provides access to the different available fonts associated with the operating system. The font size can be changed as well.
 
Text Title
The default text associated with the text component will be displayed and can be edited.
 
Formatting
Typical formatting capabilities are available including bold, italics, underline, font color, and alignment (left, center, right).
 
Show Legend
Show Legend checkbox selected (default) means the legend is displayed. Deselecting the checkbox hides the legend. 
 
Legend Alignment
Four locations for the legend - top, bottom (default), left or right can be selected. 
 
Name Composition Checkboxes
This allows for the ability to differentiate between the output variable names for multiple results sets. For example, by selecting the check box, such as "area", the area name associated with that output variable is displayed after the output variable name shown in the field below Entity Display.  Multiple selections can be made and the order in which they will be incorporated with the output variable name are in the order that they are shown. 
 
Font
The drop down list provides access to the different available fonts associated with the operating system. The font size can be changed as well.
 
Formatting
Typical formatting capabilities are available including: bold, italics, underline, font color, and alignment (left, center, right).
 
 
Properties- Table
The following are the features that are available in the Table Properties Dialog box, which can be accessed. To enter move the mouse to a Results View that is displaying a table. Right click and select Properties from the pop-up dialog.
 
Entity Display
This provides a list of the output variables that are currently included in the Results View and how they will be displayed within the Results View legend. By selecting one of the output variables, the name appears in the Variable Name field and the Legend name field, the latter can be edited. The name displayed in this field can also be changed by selecting or de-selecting options for parameters within Name Composition.  
 
Variable Name
The default name is shown for the selected Output Variable.
 
Legend Name
This allows the text representation of the legend name to be updated. For example, shortening the name so that it fits better within the legend and the legends location on the graph may be desired.
 
Name Composition Checkboxes
This allows for the ability to differentiate between the output variable names for multiple results sets. By selecting the check box, such as "area", the area name associated with that output variable is displayed after the output variable name shown in the field below Entity Display.  Multiple selections can be made and the order in which they will be incorporated with the output variable name are in the order that they are shown.  
 
Font
The drop down list provides access to the different available fonts associated with the operating system. The font size can be changed as well.
 
Formatting
Typical formatting capabilities are available including: bold, italics, underline, font color, and alignment (left, center, right).
 
Decimal Places
Controls the number of decimal places that are displayed in the cells within the table associated with that output variable.