Cooling Mode
Capacity Curve
This equation uses a least square method with a set of performance coefficients to simulate heat pump performance
The equation for the Capacity Curve is:
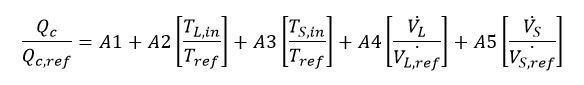
Where:
Qc = Load Side Heat Transfer Rate
Qc,ref = Highest Cooling Capacity / Design Cooling Capacity
A1-A5 = Equation Fit Coefficients for Cooling Mode Capacity
TL,in = Entering Load Side Water Temperature, K
Tref = 283.15 K
TS,in = Entering Source Side Water Temperature, K
The curve has the following fields:
X Axis:Tload (°F)
Y Axis: Full Capacity (%)
Power Curve
This biquadratic curve shows the percentage of full load power as a function of the load. The equation for the Power Curve is:
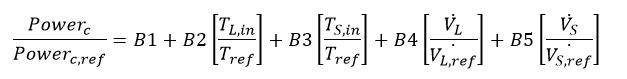
Where:
Powerc = Power Consumption in Cooling Mode
Powerc,ref = Highest Power Consumption/ Design Power Consumption Capacity
B1-B5 = Equation Fit Coefficients for Cooling Mode Capacity
TL,in = Entering Load Side Water Temperature, K
Tref = 283.15 K
TS,in = Entering Source Side Water Temperature, K
The curve has the following fields:
X Axis:Tload (°F)
Y Axis: Full Capacity (%)