Curve tab
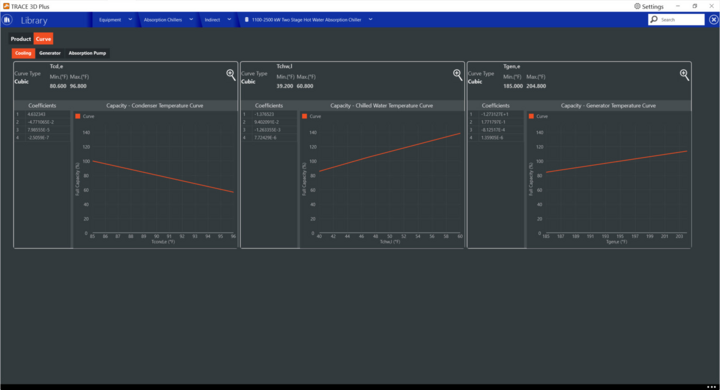
Cooling sub tab
Capacity – Condenser Temperature Curve
This cubic curve correlates the chiller’s evaporator capacity as a function of the condenser entering water temperature. This curve is used to correct nominal capacity at off-design condensing temperatures.
The equation for the capacity curve is:
Where:
y = Cooling Capacity
C1 to C4 = coefficients
X = Condenser entering water temperature
The curve has the following fields:
X Axis: Entering Condenser water temperature (°F, °C)
Y Axis: Cooling Capacity (%)
Tcd,e Min / Max : Minimum and maximum entering condenser water temperature values (°F, °C). These values determine the X axis range.
Capacity – Chilled Water Temperature Curve
This cubic curve correlates the chiller’s evaporator capacity as a function of the evaporator leaving water temperature. This curve is used to correct nominal capacity at off-design evaporator temperatures.
The equation for the capacity curve is:
Where:
y = Cooling Capacity
C1 to C4 = coefficients
X = Leaving chilled water temperature
The curve has the following fields:
X Axis: Leaving chilled water temperature (°F, °C)
Y Axis: Cooling Capacity (%)
Tcd,e Min / Max : Minimum and maximum leaving chilled water temperature values (°F, °C). These values determine the X axis range.
Capacity – Generator Temperature Curve
This cubic curve correlates the chiller’s evaporator capacity as a function of the generator’s entering water temperature. This curve is used to correct nominal capacity at off-design evaporator temperatures and is only used for Hot water Generators.
The equation for the capacity curve is:
Where:
y = Cooling Capacity
C1 to C4 = coefficients
X = Generator entering water temperature
The curve has the following fields:
X Axis: Generator entering water temperature (°F, °C)
Y Axis: Cooling Capacity (%)
Tcd,e Min / Max : Minimum and maximum values for the generator’s entering water temperature (°F, °C). These values determine the X axis range.
Generator sub tab
Generator Power Curve
This cubic curve correlates the heat input as a function of the chiller’s part load ratio.
The equation for the capacity curve is:
Where:
y = Heat input
C1 to C4 = coefficients
X = Chiller’s part load
The curve has the following fields:
X Axis: Part Load (%)
Y Axis: Generator’s Power, Heat input (%)
Load Min / Max: Minimum and maximum Load. These values determine the X axis range
Generator – Condenser Temperature Curve
This cubic curve correlates the chiller’s heat input as a function of the condenser entering water temperature. This curve is used to correct the generator heat input at off-design condensing temperatures.
The equation for the capacity curve is:
Where:
y = Heat input
C1 to C4 = coefficients
X = Condenser entering water temperature
The curve has the following fields:
X Axis: Condenser entering water temperature (°F, °C)
Y Axis: Generator’s Power, Heat input (%)
Tcd,e Min / Max : Minimum and maximum condenser entering water temperature. These values determine the X axis range
Generator – Chilled Water Temperature Curve
This cubic curve correlates the chiller’s heat input as a function of the evaporator leaving water temperature. This curve is used to correct the generator heat input at off-design evaporator temperatures.
The equation for the capacity curve is:
Where:
y = Heat input
C1 to C4 = coefficients
X = Evaporator leaving water temperature
The curve has the following fields:
X Axis: Evaporator leaving water temperature (°F, °C)
Y Axis: Generator’s Power, Heat input (%)
Tchw,l Min / Max : Minimum and maximum leaving chilled water temperature. These values determine the X axis range
Absorption Pump sub tab
Pump Power Curve
This cubic curve correlates the pump electric power as a function of the chiller’s part load ratio.
The equation for the capacity curve is:
Where:
y = Pump Power
C1 to C4 = coefficients
X = Chiller’s part load
The curve has the following fields:
X Axis: Part Load (%)
Y Axis: Pump Power (%)
Load Min / Max: Minimum and maximum Load. These values determine the X axis range.