Left side bar
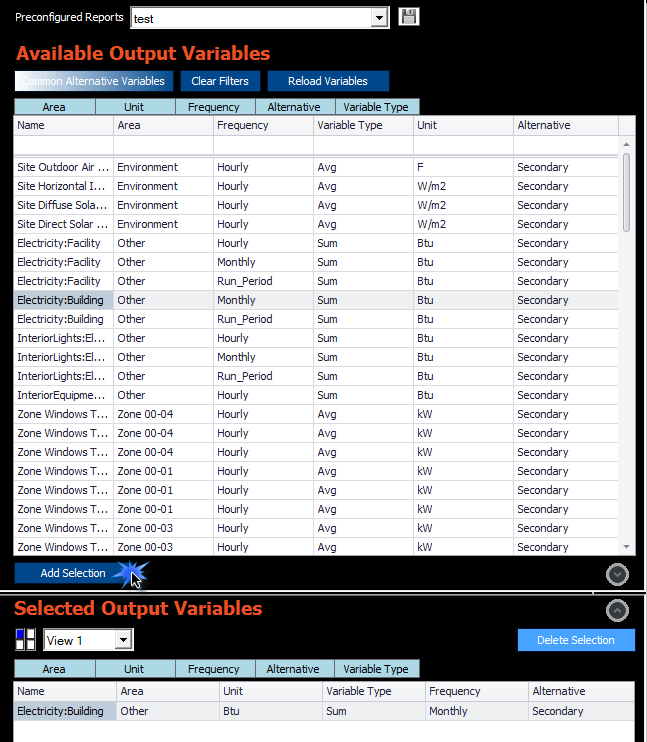
The left side bar in the visualizer tool is used for selecting output variables used in viewing output data in the graph and tables viewing pane. The side bar includes an option to select or save a pre-configured output report or to add output variables used for viewing in the Available Output Variables list.
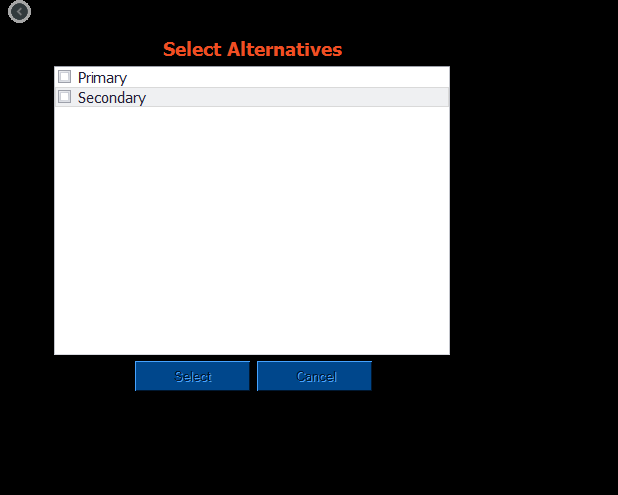
Select Alternatives
The alternatives selection allows the selection of the alternative’s outputs to be viewed using the visualizer tool. Only alternatives where the visualizer was enabled and simulated will appear in the alternative selection dialog window.

Pre-configured Report
The pre-configured report selection allows a set of output variables with appropriate formatting of the graph to be selected quickly. Since not all variables are output for each simulation run, there may be missing outputs variables that correspond to the selection of the pre-configured report. In these cases, the visualizer report graphs or tables will be incomplete.

Save Configuration
The Save Configuration button allows a custom set of output variables and custom chart/graph properties to be saved for the purpose of quickly referring custom reports. First, select the output variables from the “Available Output Variables” list and select “Add Selection”. After selecting the output variables the output viewing area can be manipulated by adjusting the chart types and graph properties.

Hit the “Save Configuration” button and name the report. The newly created output report will be available on the list of Preconfigured Reports.
Available Output Variables
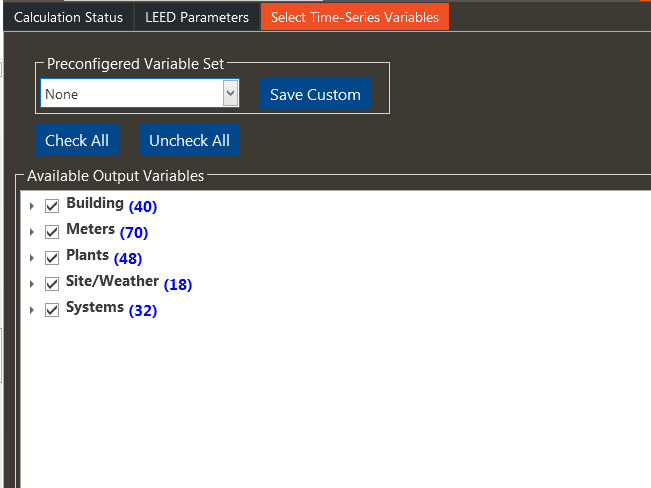
This displays the Output Variables that are available to incorporate into Results Views. The list is determined by the Output Variables that are defined in the Select Time-Series Variables screen that is established pre-simulation. The table contains a number of ways that the Output Variables Set can be filtered, so that they can be managed more effectively to obtain the desired Output Variable selection.

Once identified and chosen select Add Selection. This will add that Output Variable to the Output Variable Selection table and incorporate it into the active Results View.

Input Considerations:
Simulation time and the size of the Results file are directly related to the number of Output Variables that are included in the selection of the time-series variables. This is the main reason why all of the available output variables and meters that are available in the application should not be selected. It is important to be selective which output variables are needed to be investigated in the Visualizer before selecting the output variables. While in the visualizer, if the results for an output variable that is not available for selection, are needed then that Output Variable will need to be added and the simulation rerun.
Common Alternative Variables
The “Common Alternative Variables” button provides a filter to only display output variables that contain data for multiple alternatives. When selecting this button and selecting variables, all alternatives that have data associated with that output variable will be added to the selected output variables section.
For example, if Alternative 1 and Alternative 2 both contain DX Coil output variable data, then that output variable will appear in the available output variable list when “Common Alternative Variables” is selected.
Clear Filters
The “Clear Filters” button clears the output variable filters that had previously been applied to the list of Available Output Variables. Filters can be applied to the list of Available Output Variables by clicking on the down arrow filter options in the column list headers.
Add Selection
After selecting a variable in the Available Output Variables list, click the “Add Selection” button to add the output variable to the Selected Output Variable list. When adding variables to the Selected Output Variables list, the units for the variables selected cannot exceed 2 units. For example, Outdoor Dry Bulb, Outdoor Relative Humidity, and Wind Speed cannot all be added to the Select Output Variables because they each contain different units.
Active View
A drop down list located beneath the Selected Output Variables header allows the selection of different views to make active within the current view configuration. The drop down list will display the number of views created. Once a new result view selection has been made, the Selected Output Variable table updates to display the output variables associated with the active Results View.
Delete Selection
Selecting Delete will remove the current output variable highlighted within the Selected Output Variables table from the table as well as from the current Results View.
Selected Output Variables
The Output Variables associated with the current Results View are displayed in this table. If there is more than one Results View, the active Results View can be changed by either selecting from the drop down list above the table or selecting the view directly. Changing the active view will modify the Output Variables shown in the table. The columns in the Selected Output Variables table can be varied by selecting the column headers shown below the view drop down list. The columns displayed in the table below can be toggled on/off by either selecting (colored) or deselecting the column header. In addition, Output Variables can be deleted from the table and, ultimately, the current view by selecting the output variable and then hitting the “Delete Selection”.